UI Screenshots
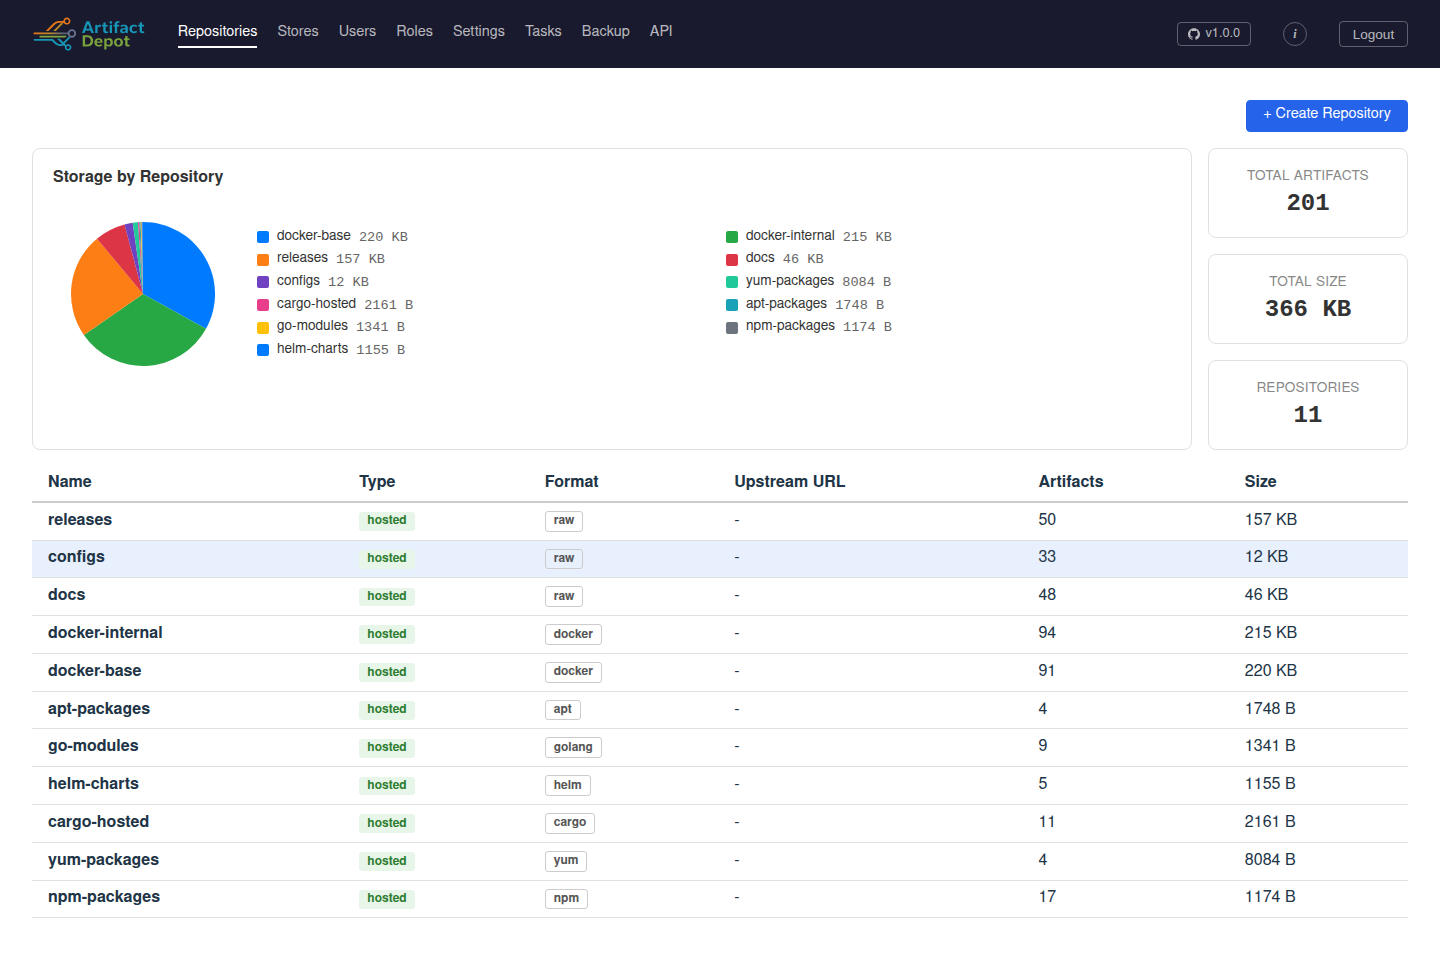
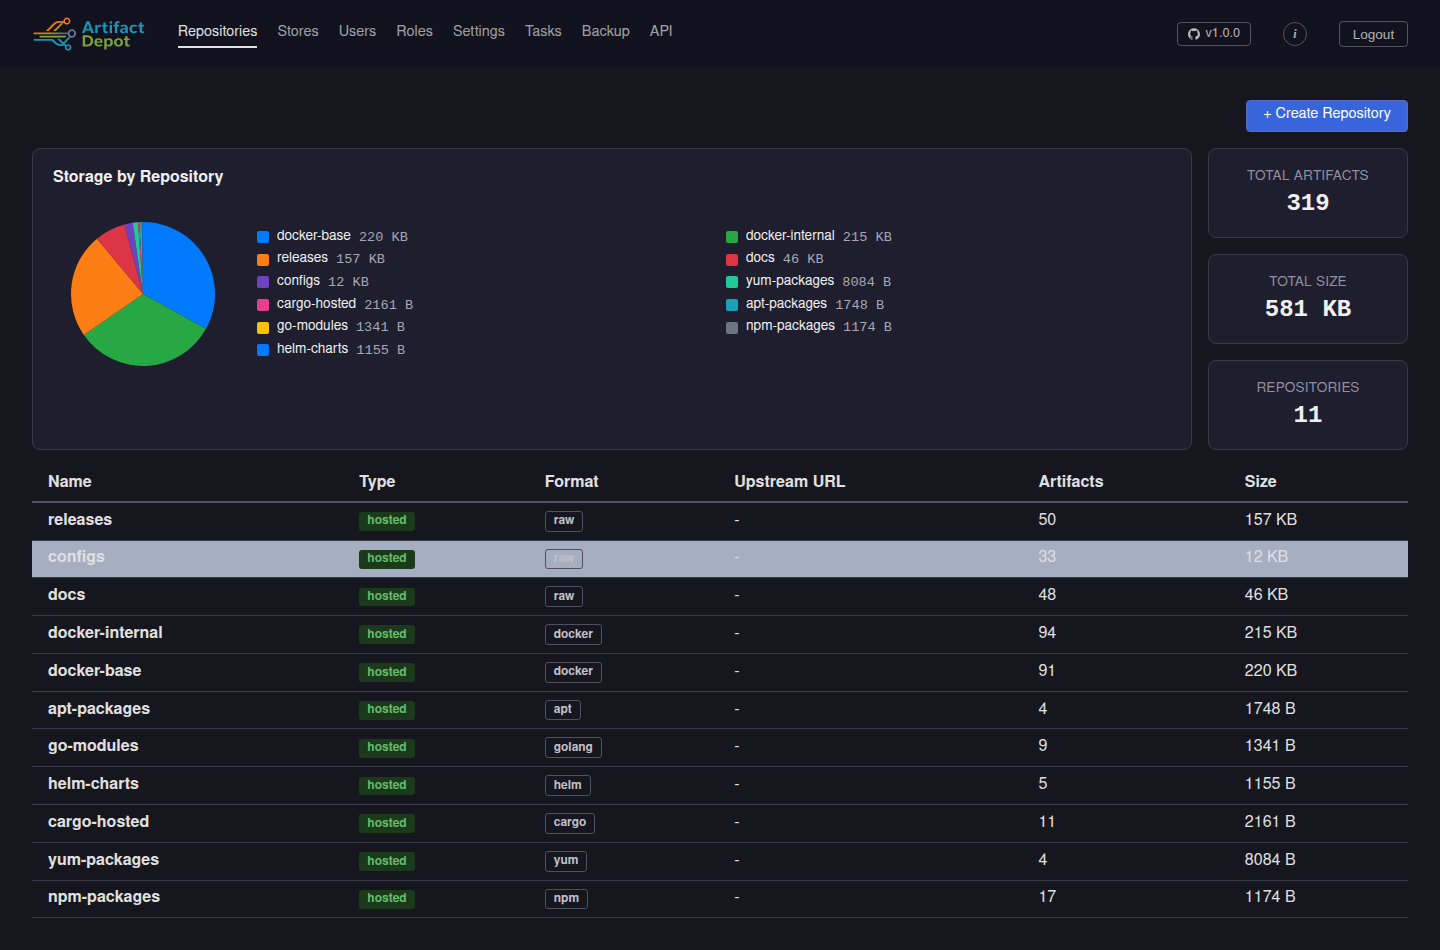
Repositories
The Repositories page is the dashboard. The header summarises totals across the cluster (artifact count, on-disk size, repository count) and breaks the storage footprint down by repository in a pie chart. Every artifact format – raw, Docker, APT, Yum, PyPI, npm, Cargo, Helm, Go – appears in the same flat list with a colour-coded format badge.
Repository detail (Browse)
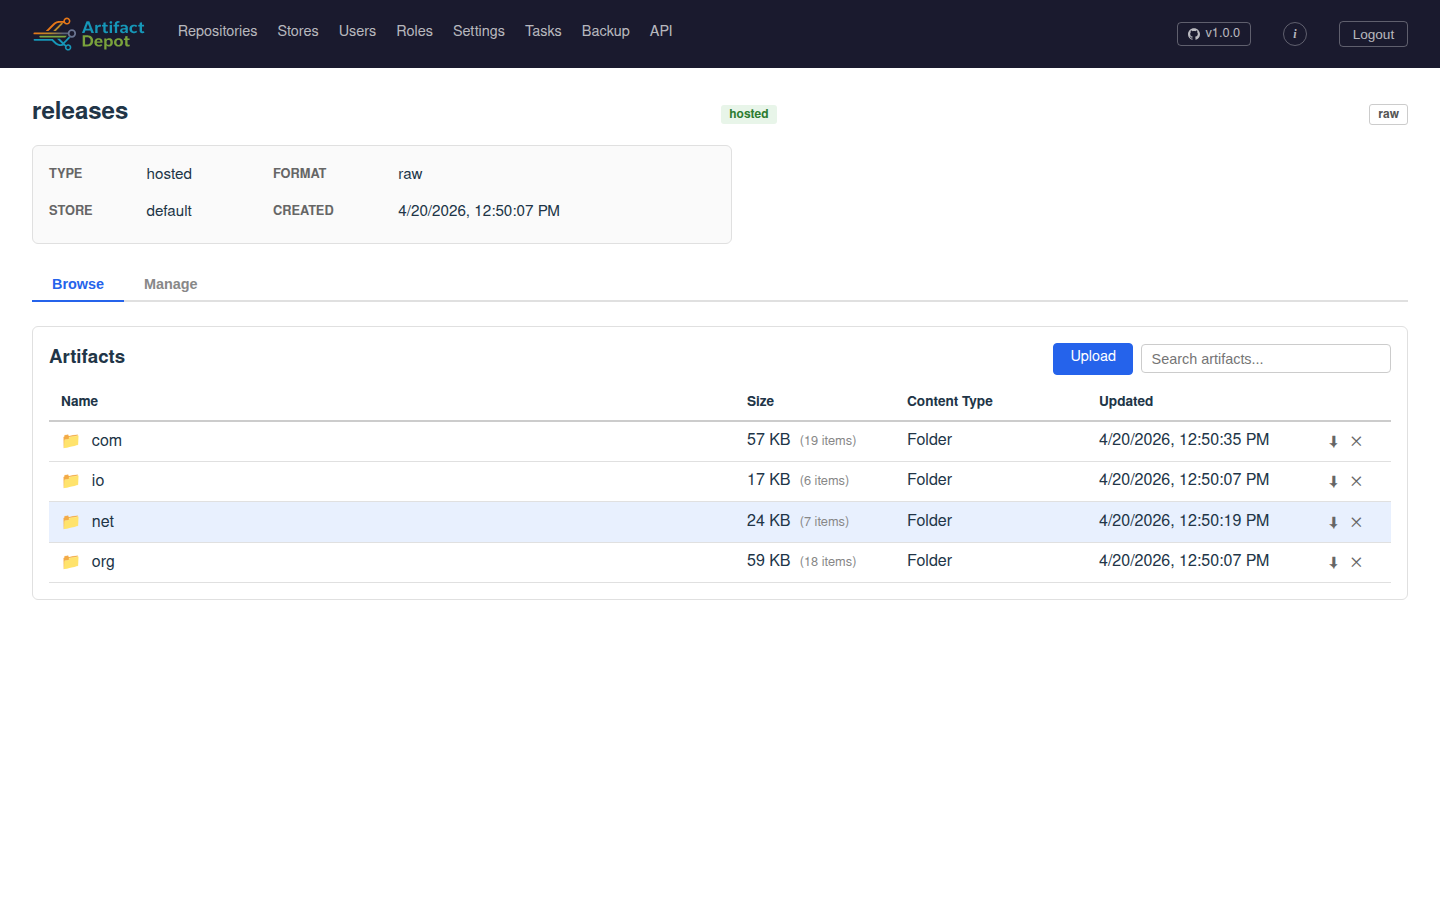
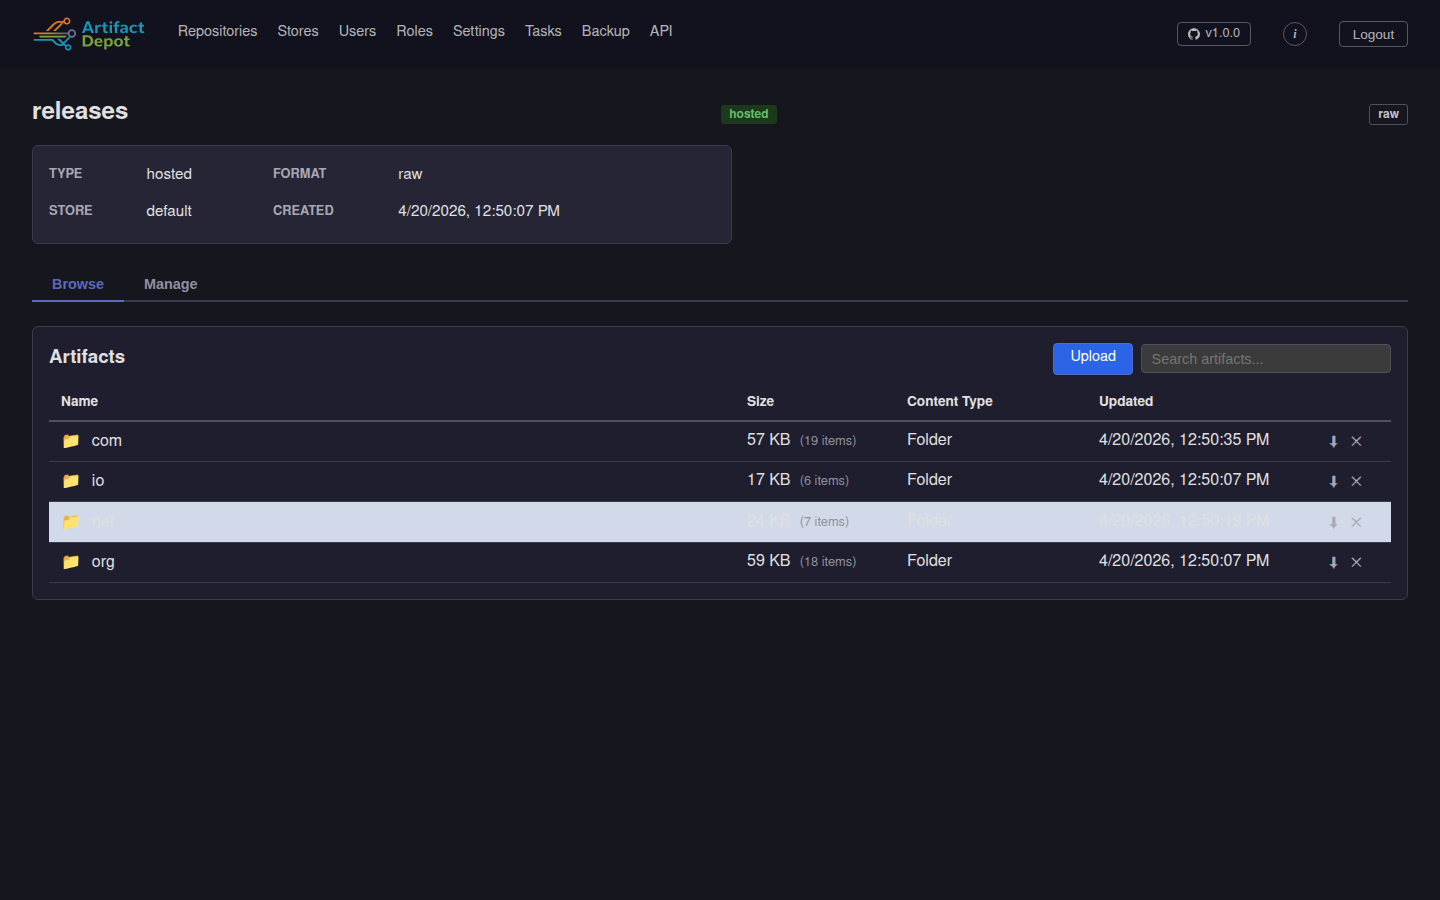
Clicking into a repository opens its artifact browser. The tree is lazy-loaded; the Size column shows aggregated bytes per directory, and the Updated column reflects last-modified times. Hosted, cache, and proxy repos all share this layout – only the top header changes.
Stores
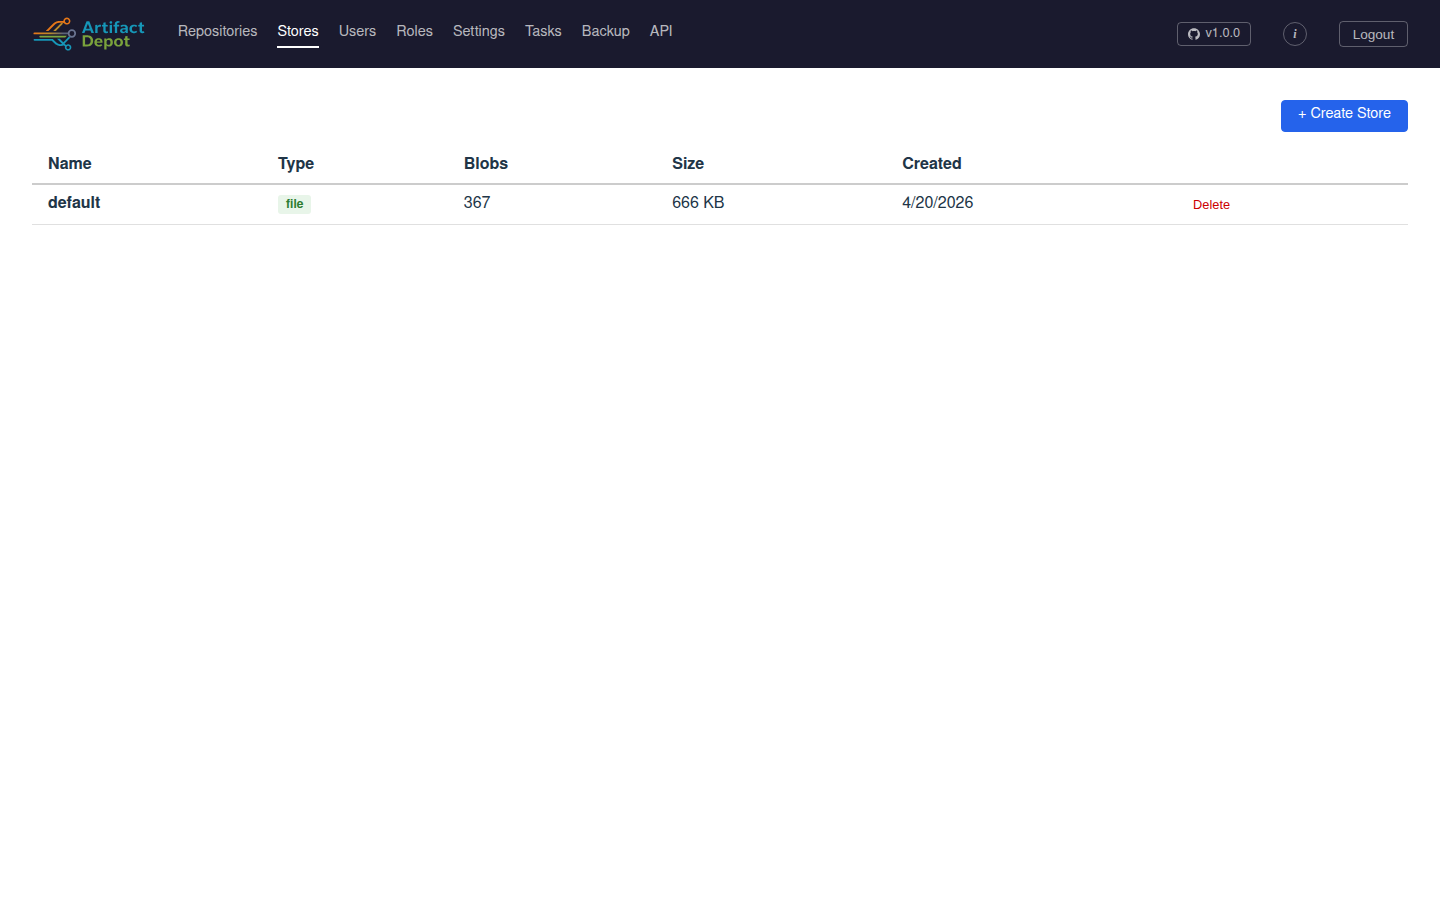
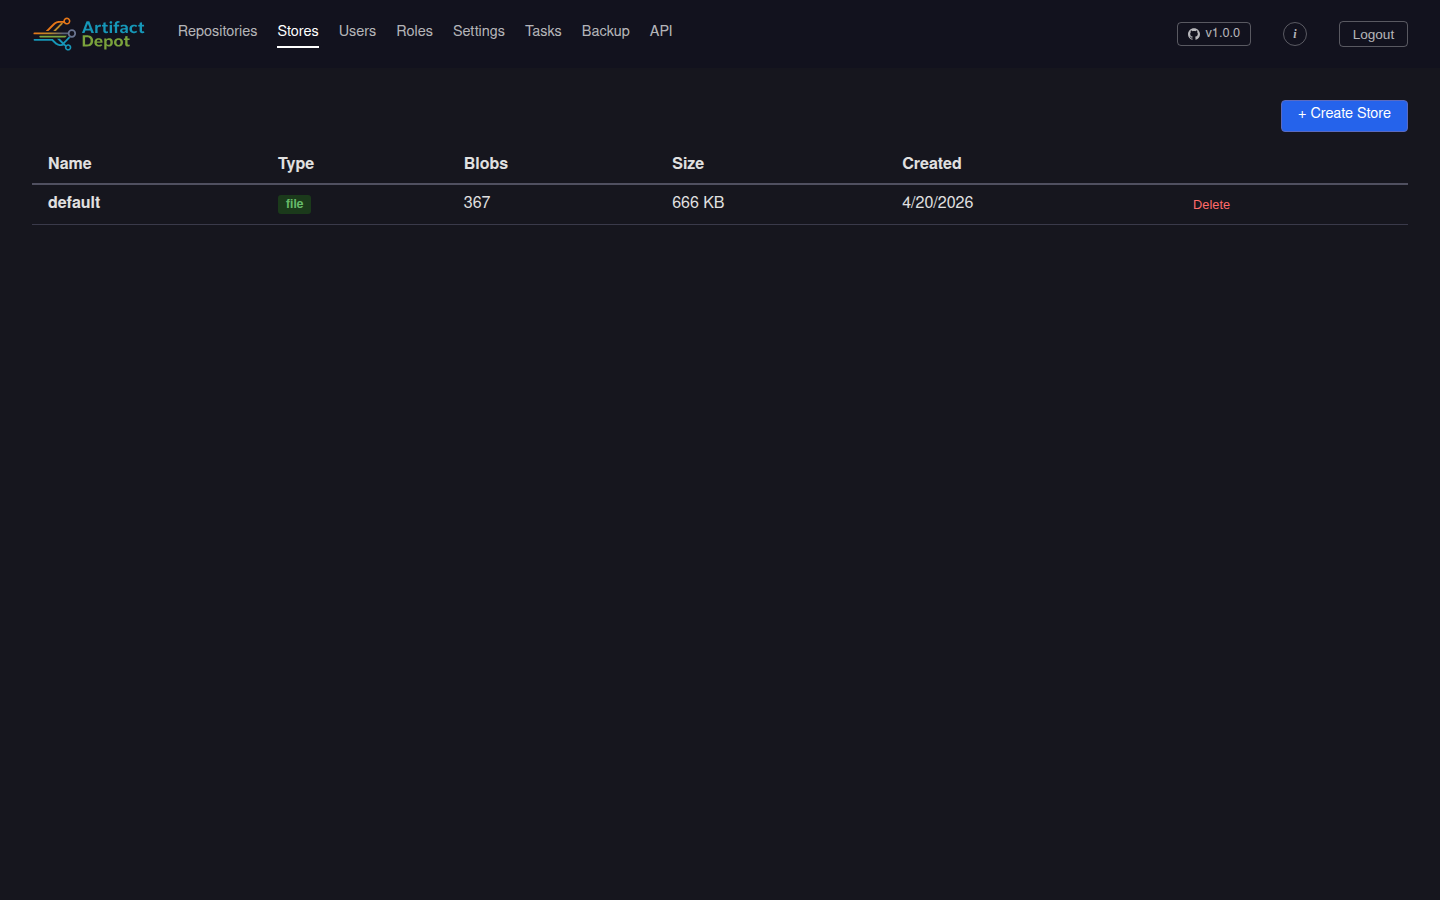
Blob stores are managed independently from repositories. The list shows which storage backend each store uses (file or S3), the live blob count maintained by GC, and the on-disk total.
Store detail (Browse)
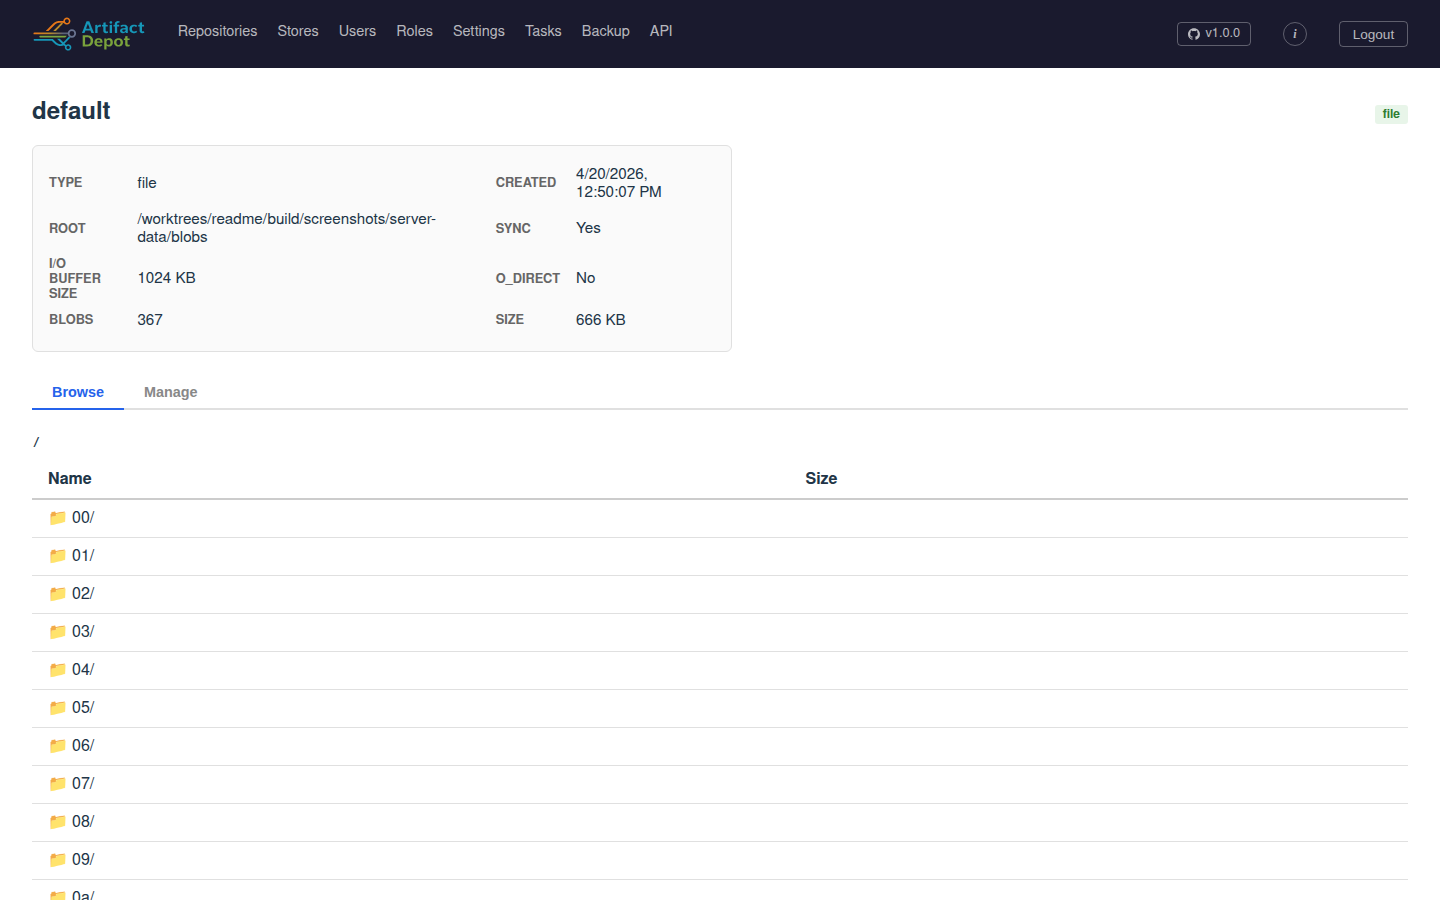
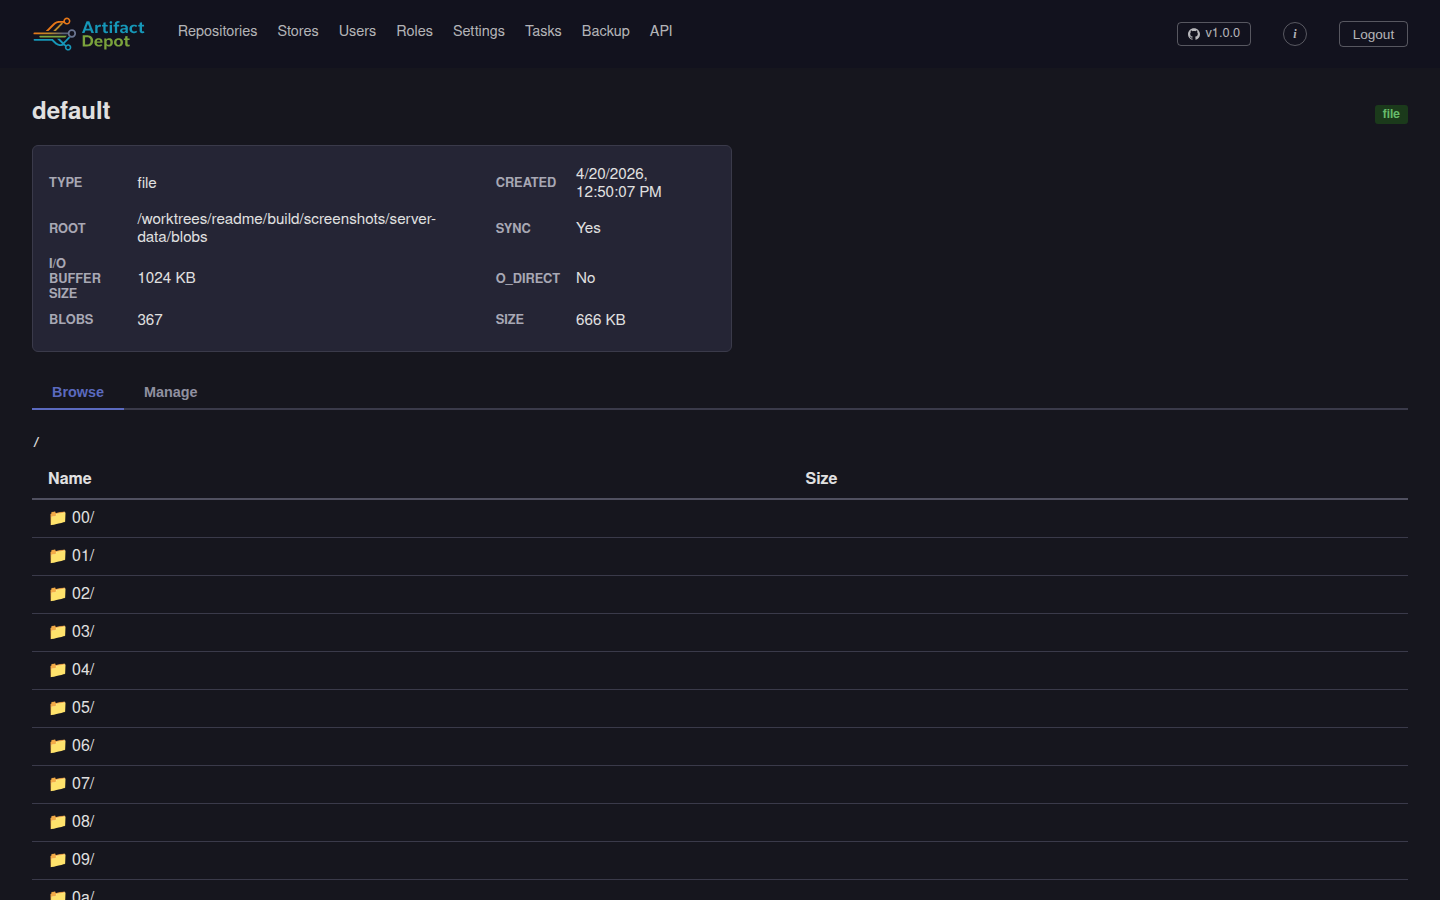
The store detail page exposes the physical content-addressable layout underneath – directories are the first two prefix bytes of each BLAKE3 blob ID, with the actual blob files at the leaves.
Tasks
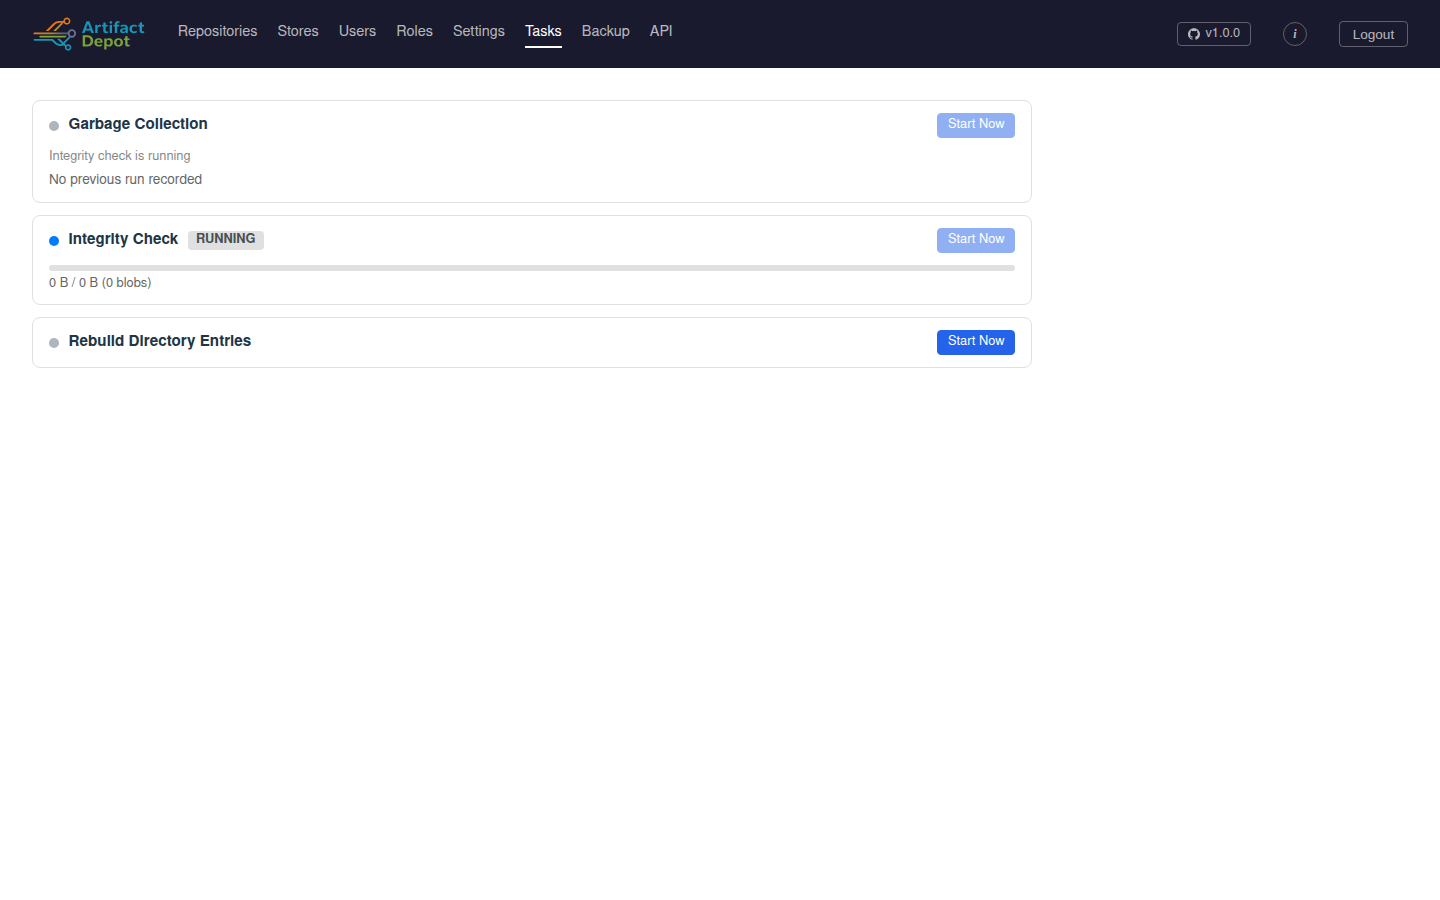
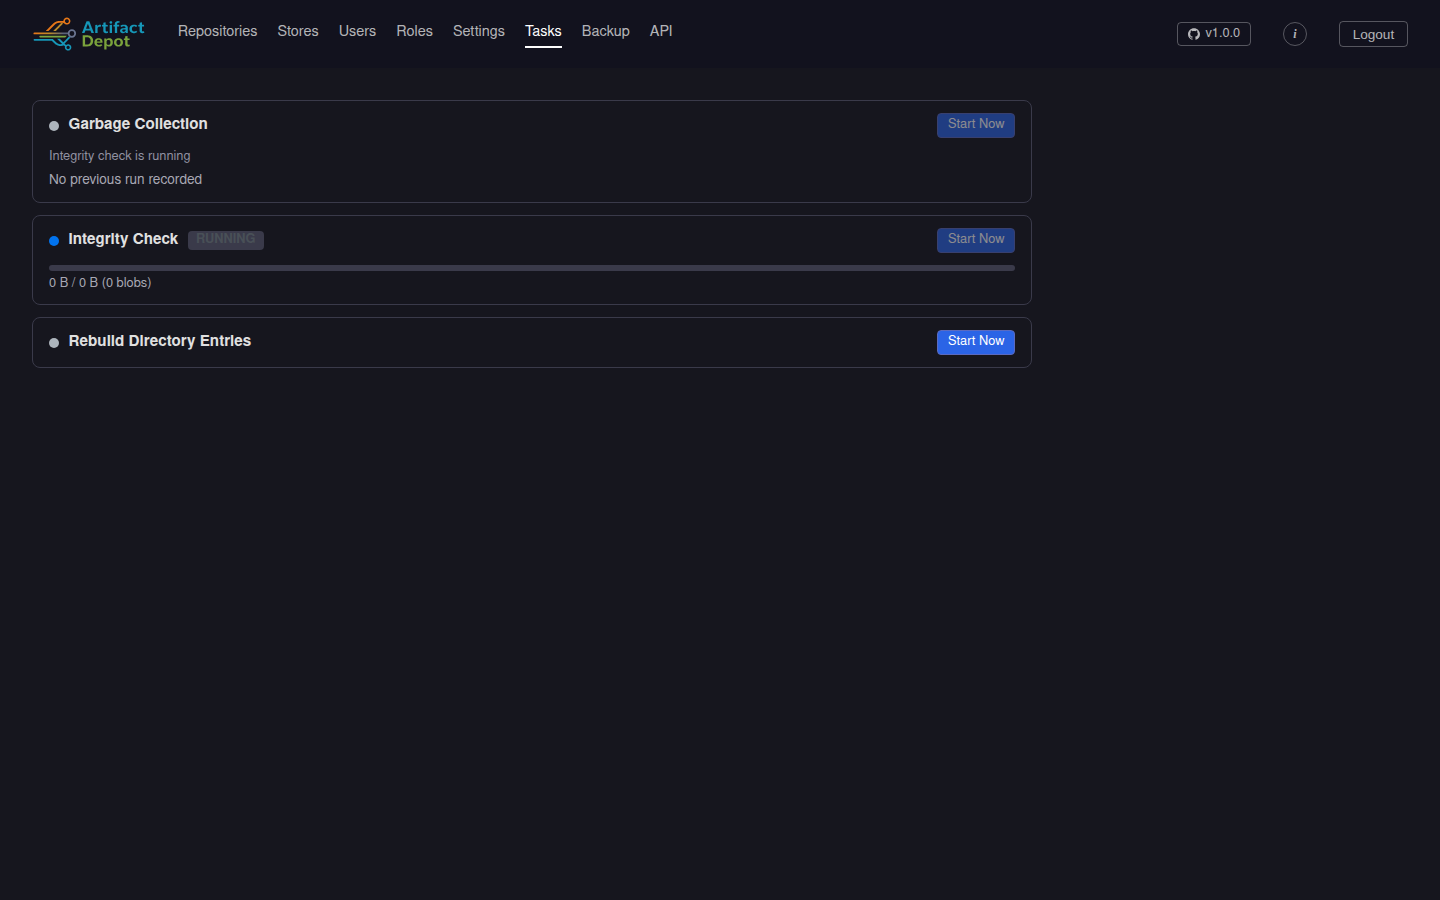
The Tasks page lets an operator kick off the singleton background jobs (Garbage Collection, Integrity Check, Rebuild Directory Entries) and watch them run. Progress bars stream live byte and blob counts; the last completed result for each job stays on the page until the next run.
Settings
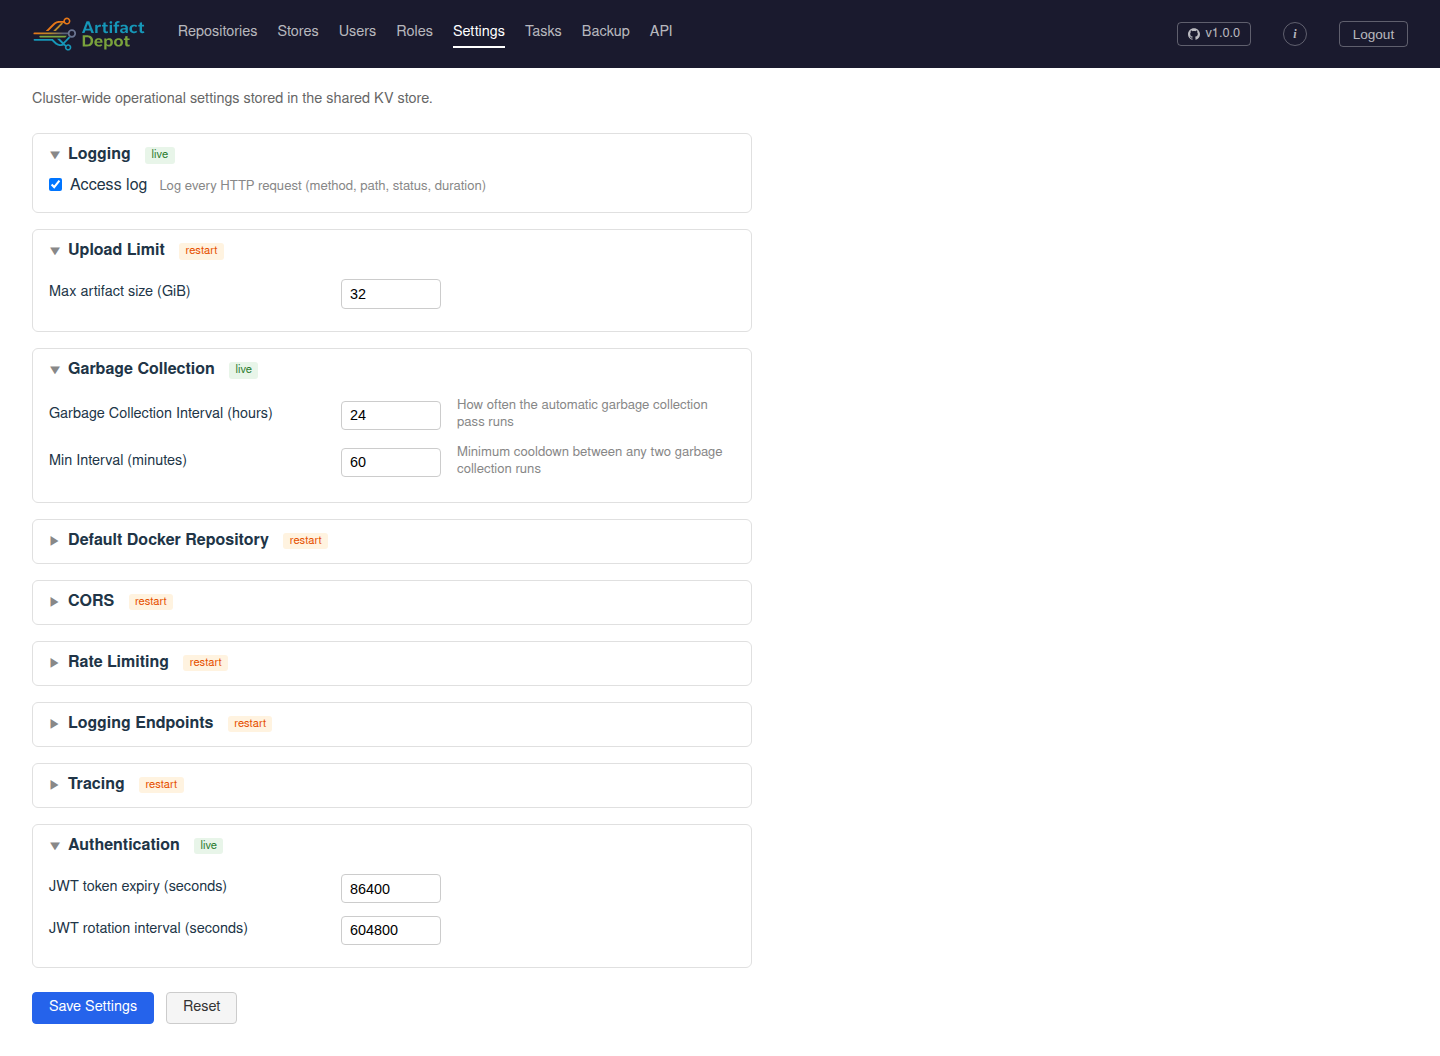
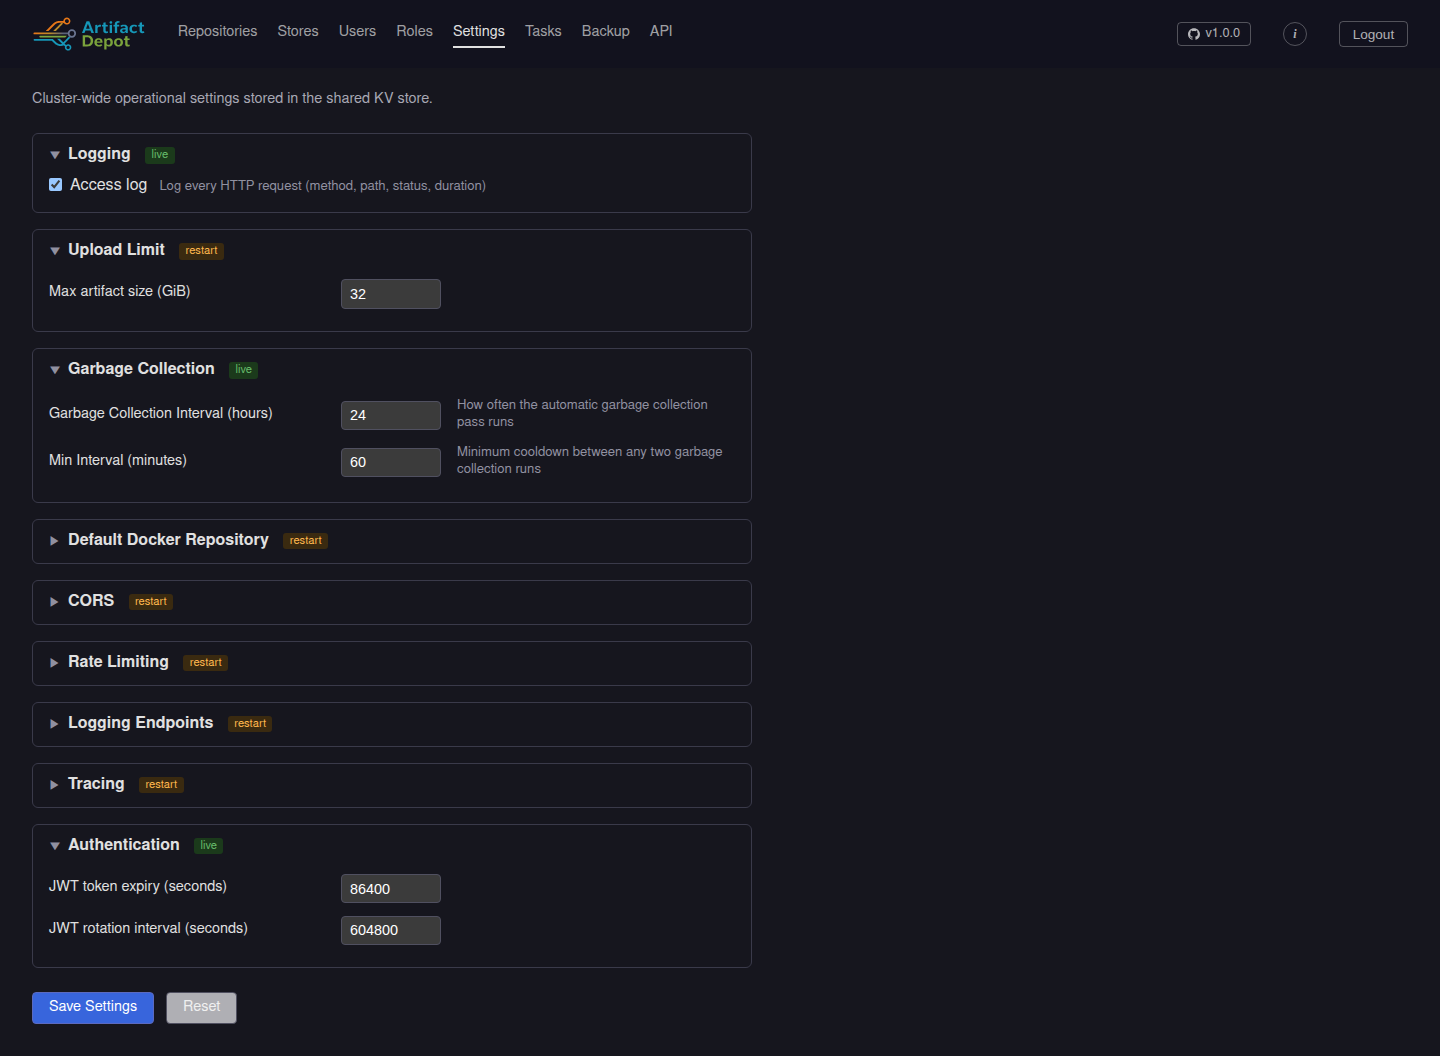
Cluster-wide operational settings – access logging, upload size limits, GC interval, default Docker repo, CORS, rate limiting, tracing endpoint, and JWT lifetimes. Changes propagate to every cluster instance within the 30-second refresh window.
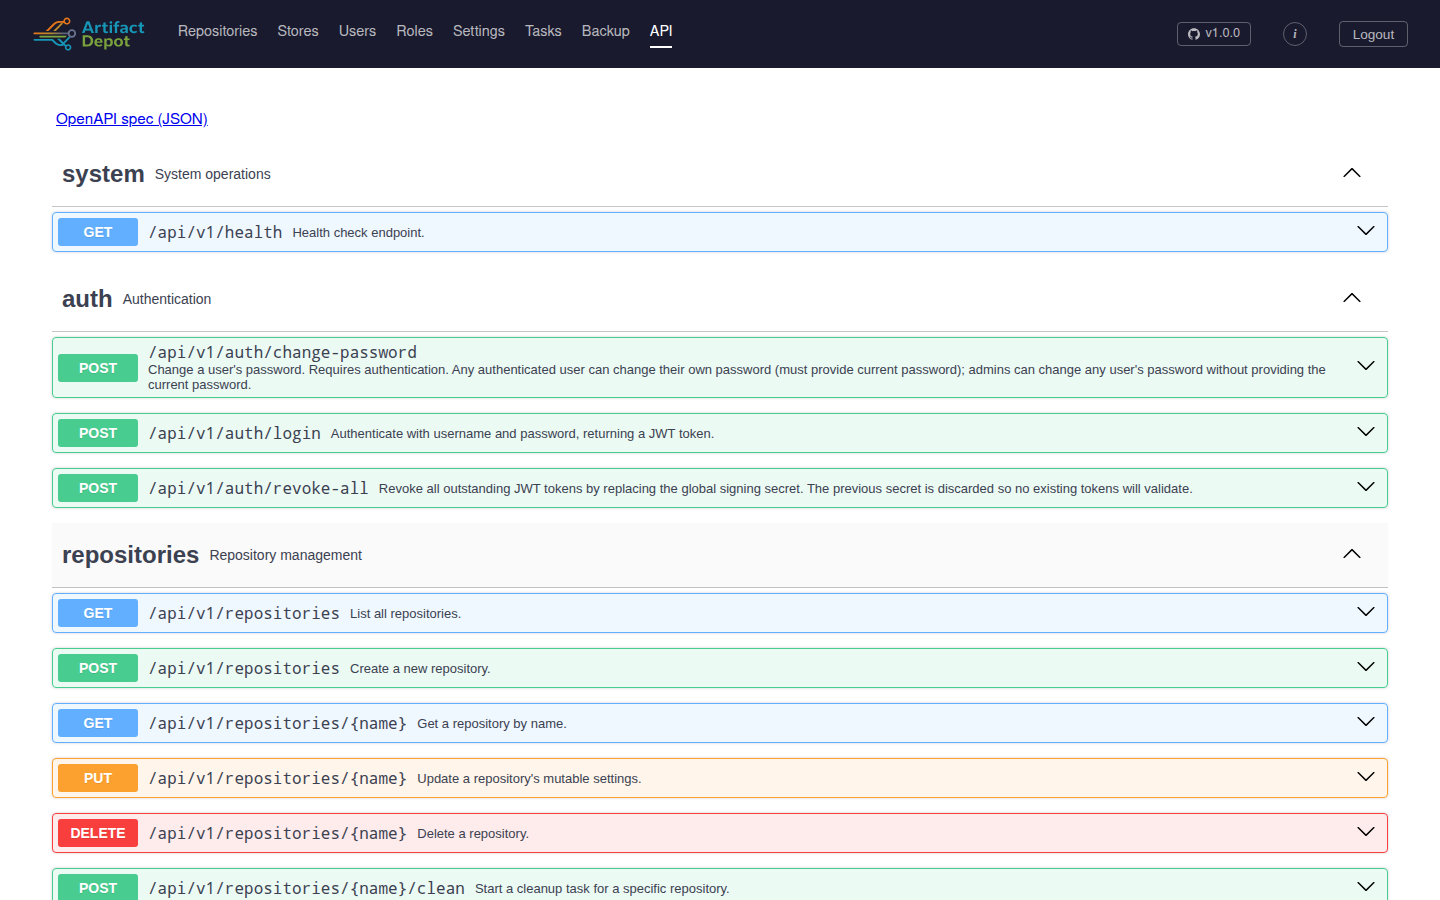
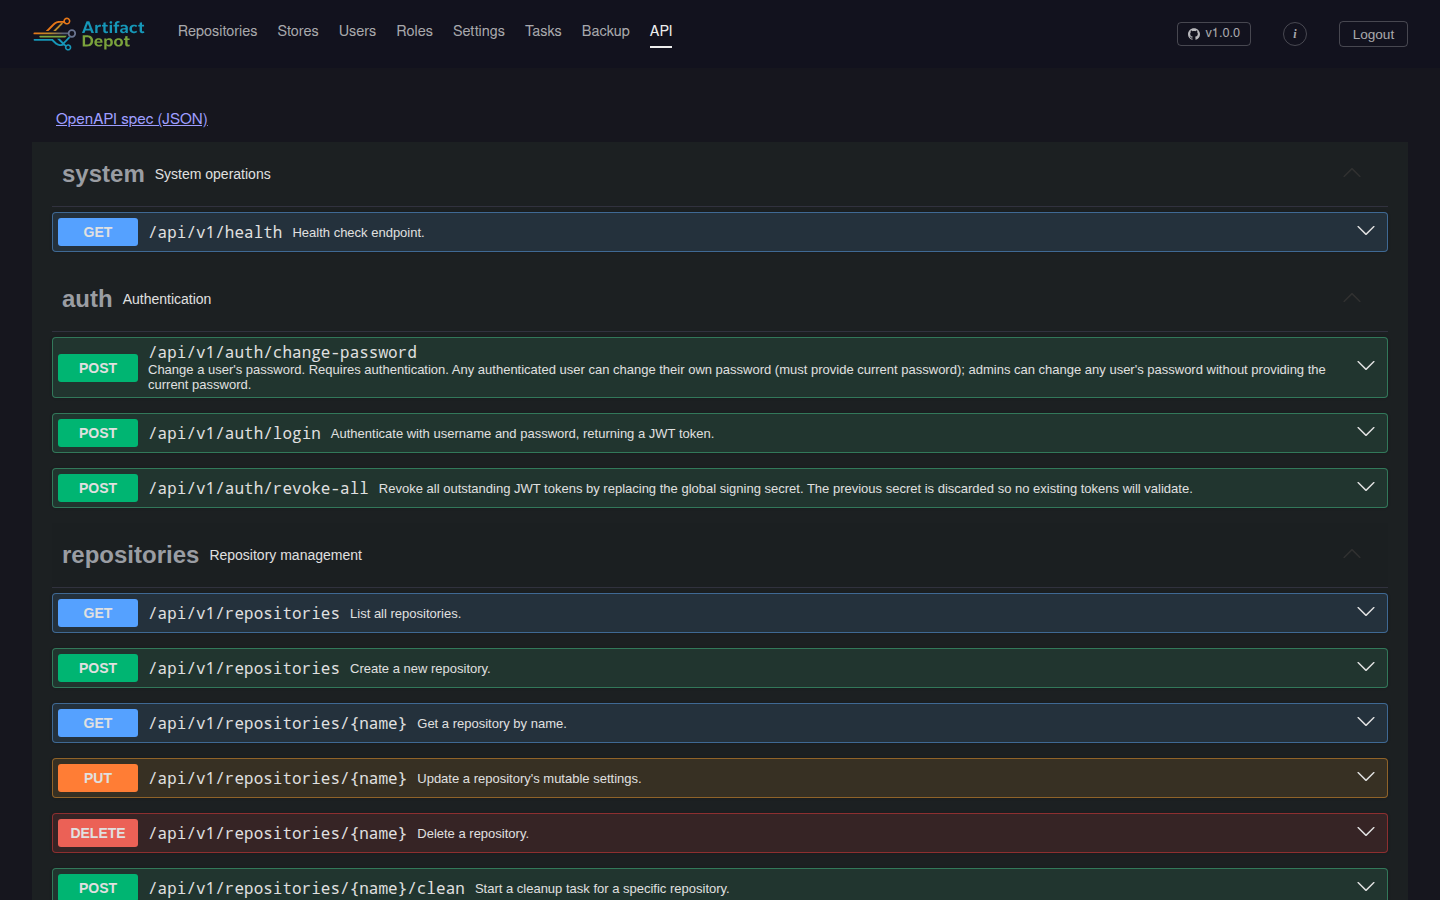
API documentation
The full OpenAPI spec is rendered in-browser via Swagger UI. Every endpoint can be expanded to inspect parameters, request bodies, response schemas, and try-it-now interactively against the live server.